How to Improve Risk Management
How Risk Management Made Safety More Measurable and Meaningful
Autor : Ian Gabrielides
Understanding Risk Management Systems in Safety
When someone sets themselves a personal objective, they often find that they need to measure their progress at set intervals to ensure that they’re on the path to completing the objective successfully. This could be someone aiming to run a marathon that needs to keep a track of their distances and times, or someone looking to lose weight that needs to weigh themselves at frequent intervals to keep themselves on track towards their target weight. Measuring progress in these scenarios can give someone a boost with positive results and provide a wakeup call and perhaps a change of tactics when the results aren’t what they need to be. Introducing the safety Risk Management system made safety activities as measurable as the personal objectives in these scenarios.
Before a risk management system was introduced, it was a challenge to track the impact that our safety teams had on our Safety performance.
Waiting on standard safety lagging KPI’s was like waiting for something to happen/not happen to demonstrate how effective our safety focused activities had been. We would measure associate involvement levels and the hours spent on safety. But was this progress? Was this impactful?
Were we getting better? Luckier? Safer? I honestly couldn’t tell. I stood by the notion that the more that you can put in, the more you’ll get out. If we do enough of the right things, we should be better, safer, year-on-year. We’ll focus on close calls (near misses), first aids, accidents etc. Let’s never repeat the mistakes. Let’s focus on people, its our best chance to keep our people safe.
Then along came the Risk Management system and it changed the game – it gave us the capability to keep score, for safety. We were able to track and chart progress. With a numerical value, linked to risk, we could answer questions like, are we on plan? Are we making progress, in the right direction, at the right pace? Are we likely to meet our short, medium, and long-term safety objectives? It revolutionized the Safety System - immediately. Well, it would have done that, if I’d understood it straight away, it took several months, possibly a year, to understand what the system could do to take our safety process to the next level. Back in 2009, when the system was introduced, if I had a graphic like the one below it would have helped me visualize how the system would work. My initial concern was that it was that the system would be a compliance system rather than improvement system.

The graphic above isn’t an exhaustive list of the key process and people ingredients of a Safety Management System, and it can be argued that there are elements of process and people in each of the building blocks, so there isn’t a hard left/ right split. But the graphic is a pictural view of the Risk Management journey I’ve witnessed at Milliken since the Risk Management System was formally adopted by Milliken Europe in 2009. It opened my eyes to a smarter way of leading safely.
The Early Days of the Risk Management System
The introduction of the Risk Management System was led by two key, passionate, Safety leaders, Tony McCarthy (EHS Leader for Milliken Europe) and Paul Crabtree (Quality & EHS Leader for Milliken European Airbag Products). Tony, new to Milliken, had seen the same opportunity as Paul, a gap, an organization that was not utilizing risk management tools in a systemized way. Our dedication to safety wasn’t in question. We have always invested in Safety, with all associates actively involved in safety through teams or completing audits. We invested time and energy to achieve incremental gains.
The Risk Management System Framework
The key components of the Risk Management system are managed in the following way

 The combination of System, Operational and Guidance standards manage risk across the business. Meeting or following these standards ensures that risk is minimized, and improvement activity is focused on the key gaps. The Risk Management system accepts that there is risk within any organization and that activity must be prioritized to address where the highest risk is. The Swiss Cheese metaphor is used to understand how situations can arise. In complex systems, identified hazards are prevented from causing harm by a series of barriers. Each barrier has unintended weaknesses, or ‘holes’, hence the analogy with Swiss cheese. When the slices are overlayed on each other the number of gaps reduce. However, there is a potential that every so often the various slices of cheese or barriers do not cover the gaps and someone either suffers harm or by luck only, avoids harm.
The Strategy Behind a Risk Management System
Firstly, the Risk Management System is integrated with the existing strategy deployment process. The risk reduction targets were new leading measures added to the X Matrix supplementing the lagging safety metrics. Following the traditional Hoshin Kanri process, the EHS steering group were able to identify and prioritize where the opportunities were. Traditionally, targets would be lagging measures only such as close calls/ near misses. The significance of the leading risk score measure(s) was that risk reduction could be tracked real-time based on the updated risk assessment scores. It’s more difficult to correlate EHS performance with lagging EHS measures. Did we do well this year by chance or because of the work that we did? Are we a less safe organization this year because we’ve had a worse year in respect of EHS lagging measures? Focusing on risk not only helps us track performance but it also best utilizes time and resources.

Hoshin Kanri- Risk Management Deployment Process
Leading the Risk Management Process
Leadership has several roles to play in the system. Firstly, the system has a number of System Standards. These standards are strategic, starting with the overall aspirations and objectives noted in the previous paragraph. There is also an element of accountability and responsibility regarding these standards. The appropriate leader will own these standards based on skills, education, and remit to ensure that the organization complies will the appropriate legislation and regulation.
Secondly there are thirty something Operational Standards, these range from Traffic Management to Noise and from Health Promotion to Hazardous Substances. Each Operational Standard had a leader. Some leaders lead multiple standards. Most standards would have a small team whilst others that were less of a priority may just have an owner that ensures that there is compliance to the standard. Engaging the teams was very straightforward as Milliken has a history of autonomous EHS teams working on incremental improvements.
Assigning ownership for the Operational Standards was more difficult that populating the teams to complete work. Not all Operational Standard owners/ leaders are managers. Language within the System Standards cited responsibility and accountability for each standard. These words ‘responsible’ and ‘accountable’ caused much concern and apprehension amongst those chosen to lead teams. This is a watchout for any organization looking to adopt a Risk Management system. Providing an explanation regarding what these words mean in the sense of the system and legality is advisable.
Educating the Team on Risk Control Measures
 Firstly, managers and front-line supervisors were trained to the appropriate level with qualifications. These qualifications included levels 2 & 3 IOSH Managing Safely and the Level 3 Chartered Institute of Environmental Health (CIEH) Health & Safety Understanding for Managers. It was vital we developed essential knowledge and understanding to enable managers and supervisors to discharge health and safety responsibilities to reduce the overreliance on the EHS leader. This enabled sponsors and the Operational Standard owners to be effective in leading safely and have a deeper understanding of risk management.
All Operational Standard team members undertook in-house risk assessment training to add further capability and improve confidence for those that had previous risk assessment experience. This training was a combination of classroom and Gemba training and was well received. This process was supported by the Continuous Skills Development Pillar, which drives onsite training and development.
All the training helped to address the concerns that were raised as Risk Management was implemented.
Training on Hazard Identification
Education was provided to all associates within the plant to better understand the difference between hazard and risk. Active hazard identification was encouraged through several initiatives and measured through the risk control rating. One such method was the mystery shopper. This involved a leader going onto the shop floor and doing something wrong in a controlled way, such as being the only member of a group without a hi-vis vest on or wearing jewelry on the shopfloor. Those associates that were able to spot the hazard and were confident enough to stop the manager were given formal recognition through the site recognition program. Word soon spread and more and more associates increased their hazard identification capability. They gained confidence to stop a leader and eventually enjoyed flagging a leader or indeed any associate that was doing something not in the safest way, whether they were a mystery shopper or not.
Encouraging Active Participation
 Establishing teams is the best way to achieve active participation. Teams were supported through existing daily management review and response processes, such as the monthly Safety review. Paul Crabtree also offered set ‘surgery time’ where teams or individuals could book for some support from Paul. Operational Standard teams, confident in understanding their subjects set about ensuring that the site was meeting the clauses outlined in their standard and crucially looked to identify areas for risk reduction. Participation was measured and reported during the plant daily management meeting.
Hazard Control and Risk Assessment
Hazard Control starts with Risk Assessment. The plant was in good place to control hazards due to the work that that had been undertaken so far. No two hazard control programs are ever the same, but there are fundamentals such as the need to have a standardized up-to-date risk assessment program. Key to this was the Risk Management Database that stores all safety risk assessments. This prioritized areas and standards. The database also helped to standardized what different risk assessors would score a risk in terms of, likelihood, exposure, or consequence. Each number (score) was accompanied with a description of how to score the situation, this is the scoring criteria.

The Risk Map was also introduced. This is unique one page document allows the viewer to see operational risks across an organization at a glance, in a way no other document does. It also details the risk reduction improvement history and where the latest improvement activity is taking place. The map not only covers the plant but also details interactions with customers, suppliers, and contractors.
Continuous Improvement in Reducing Safety Risks
Focused risk reduction projects and events are launched to drive down risk. Projects last either 28, 56 or 84 days. These projects follow the DMAIC step problem solving methodology. With the risk score from the risk assessment recorded as the ‘M’easure and the controlled (sustained)  rescored risk after improvements for the ‘C’ontrol step. The 28 day projects are part of a league table system. The plant has 6 teams of three associates and a sponsor. Each team is allocated a different area of the plant from the Risk Map every 28 days. Their task is to take the existing risk assessment score and reduce it in line with the annual risk reduction objective (%) as outlined in the strategy. Teams win points based on risk reduction, risk control rating reviews and the number of associates that actively engage in the project within the 28 days. Any outstanding actions are left to the team that follows. It’s a bit of fun, with a nice slice of healthy competition and is a simple way in which to engage associates across the plant. The 56 to 84 day projects tend to have larger actions and mostly focus on the priority operational standards and the highest areas of risk in the plant.
The events tend to last 1, 2 or 3 days. These are commonly known as Kaizen Events, Kai(Change)Zen(Better). For Risk Management purposes we named these Rapid Risk Reduction events. These events would have a target risk score to be reached by the end of the event. The team would compromise of a mix of associates from across the plant and would include an event leader and subject-matter-experts.
Communicating the Risk Management Process
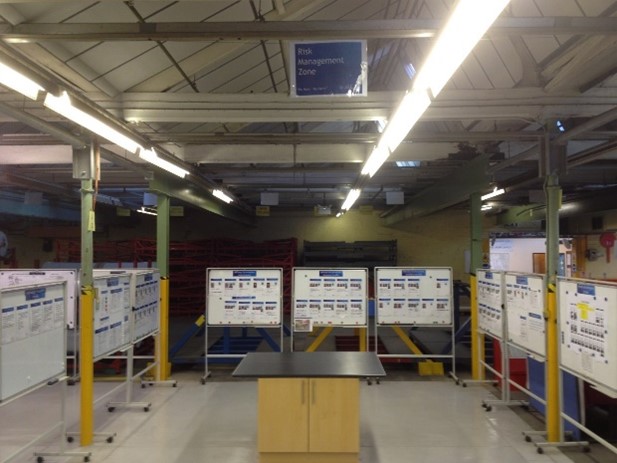
Keeping associates informed is a key input to better involvement and subsequent engagement. Risk Management communication and Daily Management events take place across the plant. Whether that’s a team center meeting or the daily management meeting. The Risk Management steering group meet weekly to review Operational Standard progress and Safety Opportunity for Improvement Cards. This meeting is the catalyst for the relevant communication to be relayed to the different stakeholders. The Risk Management weekly review takes place in the risk management zone. The Risk Management Zone is a sacred space where teams can meet in a more comfortable environment than say a meeting room.
Period Blogs are another method of communication that the site uses to update everyone. The blog details recent improvements and activities, recognition and future activities and is published every four weeks.
In summary
The introduction of the safety Risk Management System provided our organization with the capability to measure and continuously track risk reduction in the same way that a marathon runner can prepare for their big race. Unlike lagging safety metrics, there isn’t a need to wait to see if progress has been made, these metrics are live. Lagging indicators aren’t ignored but they sit alongside the leading risk indicators providing a holistic dashboard of safety performance. This highly measurable method of risk reduction and safety improvement is more engaging and leads to greater participation. At Milliken we have around 82% of our associates actively improving our safety performance. The other 18% are still involved but are focused on sustaining safety performance, for example undertaking audits.
These high levels of engagement and clear objectives has delivered some excellent results which is why we believe so much in our system. Our safety performance from 2009 to present day has seen:
- Risk Map Score 38% risk reduction
- Risk Control Rating 90% improvement
- Incident Rate 70% reduction
If you are looking for ways to improve safety in your organization as Milliken has, please get in touch with our expert consulting team for more information.